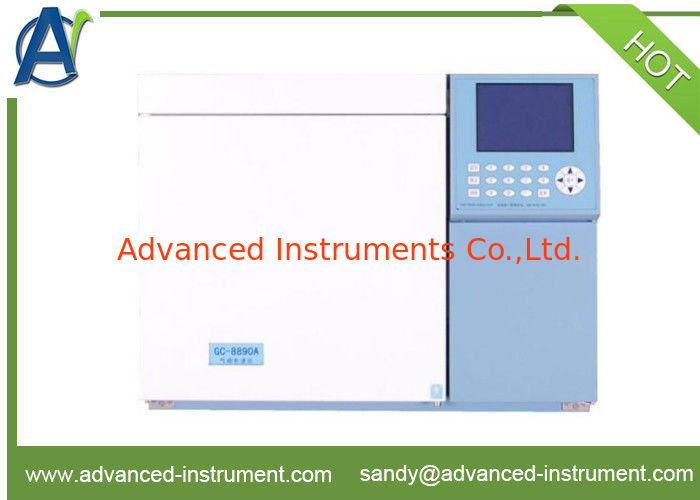
Trace CO and CO2 In Hydrogen and Light Gaseous GC Gas Chromatagraph UOP603

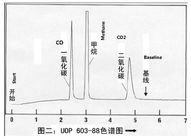
Spectrogram of UOP603
1.Principle
Trace CO and CO2 in the gas sample is injected into the packed column of GC,and methane is generated by the converter. The FID is used to detect the methane product, and the CO and CO2 contents are quantified by the external standard method.
2.Analysis instruments
2.1 Column A:9.1m1/16 inch OD,0.050 inch ID stainless steel pipe filled 80-100 mesh “TDX-01
2.2 Column B: 3m1/16 inch OD,0.050 inch ID stainless steel pipe filled 60-80 mesh 13X Molecular sieve;
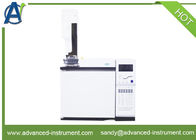
2.3 Gas Chromatagraph: constant temperature,FID detector;
2.4 Gas converter
3 Operation steps
Repeat to inject standard gas sample to obtain the peak area, and calculate the correction factor of each component with the standard gas content;Re-inject the sample and calculate the sample content from the peak area of each component of the sample.
R=A/B
In the formula: A---Content of each component;
R---Correction factor of each component;
B---Average peak area of each component,
4 Calculation
Use below formula to calculate content of each component:
Content of each component: mass-ppm=E·R
In the formula: E=peak area of each component;
R=Correction factor of each component;